Viewing Translated Assets
2 minute read
You view detailed information about individual translated assets in a translation project by clicking the Expand icon ![]() next to that project in the Lionbridge Connector Dashboard (“Dashboard”), and then clicking the Expand icon
next to that project in the Lionbridge Connector Dashboard (“Dashboard”), and then clicking the Expand icon ![]() next to an asset set for a source-target language pair. For a detailed description of the entire Dashboard, see Monitoring Translation Projects.
next to an asset set for a source-target language pair. For a detailed description of the entire Dashboard, see Monitoring Translation Projects.
To view a translated asset:
- In the Dashboard, click the Expand icon
 on the left side of the translation project whose assets you want to view. For instructions on opening the Dashboard, see Getting Started with the Connector for Episerver.
The translation-project row expands, displaying the status of the translation of each target language in the project and any relevant actions. For a detailed description of this section, see Monitoring Translation Assets.
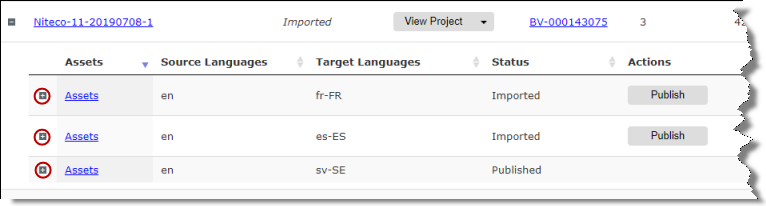
- Click the Expand icon on the left side of the asset set whose assets you want to view.

The Assets row expands, displayed the following information about each asset in the asset set:
| Column | Description |
|---|---|
| Type | The type of asset, which is either Page or Block. |
| Name | The name of the asset in Episerver. |
| Location | The relative path of the translated asset in Episerver. |
| Link | The absolute path of the translated asset in Episerver. |
- In the Link column, click the link to open the translated asset in within Episerver, where you can review and edit it, and publish it if it has not yet been published.