less than a minute
The Connector supports all web browsers that Episerver supports. The Connector supports Episerver versions 10 and 11.
To access the Connector:
-
Log into Episerver.
-
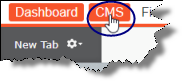
In the top-left corner, click CMS.
- In the menu that opens, click Edit.

- In the top-right corner, click the Toggle assets pane folder icon.
![]()
The Assets pane opens.
- If the Lionbridge Connector gadget is collapsed, click it to expand it.
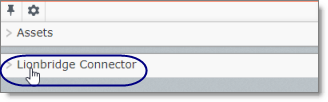
The Lionbridge Connector gadget opens. It contains basic Connector functionality, including creating a translation project. For a detailed description of the gadget, see The Connector at a Glance.
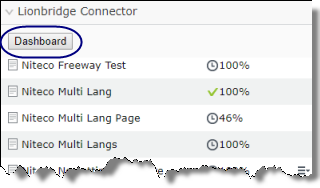
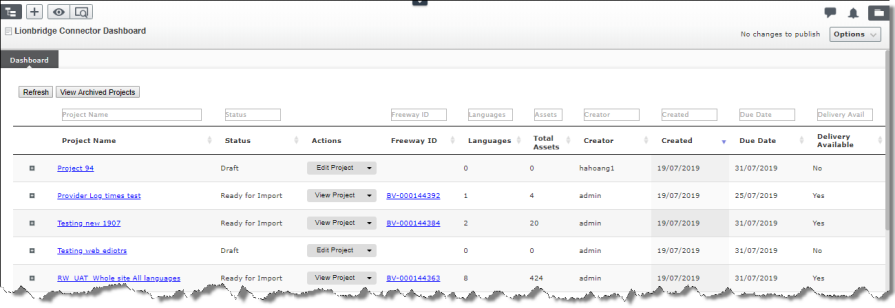
- Optional. Do one of the following to open the Lionbridge Connector Dashboard (“Dashboard”), which has enhanced Connector functionality:
-
Click the Dashboard button near the top of the gadget.
-
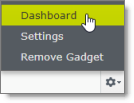
In the bottom-right corner of the gadget, click the Settings icon
 , and then select Dashboard from the context menu.
The Lionbridge Connector Dashboard opens in the system workspace. For a detailed description of the Dashboard, see Monitoring Translation Projects.
Tip: Click the Pin icon
to keep the Lionbridge Connector open by default in future sessions.